The Barcelona climate is Mediterranean: mild winters, hot summers and rainfall that peaks in autumn. Heat is the main thing to plan around, and the official weather records show how it builds through the year.
This guide is one part of the wider picture of living in Barcelona. It sets out what the Catalan Meteorological Service measures in the city, how the city council responds to extreme heat, and what to put in a suitcase for each season.
A Mediterranean climate on the coast
The Catalan Meteorological Service (Meteocat) explains in its general description of the climate that the warm, enclosed Mediterranean dampens thermal extremes along the coast and acts as a steady source of moisture. Across most of Catalonia, it summarises the pattern as a mild winter and a hot, dry summer, with winters that are mostly dry. In summer, subtropical air masses from North Africa dominate.
The same page places Barcelona in the central coastal climate group, with average annual precipitation of 550-700 mm. It also notes that the sea can feed episodes of torrential rain in autumn, especially near the coast. Autumn is therefore the season in which heavy rain is most likely.
For measured values, this guide uses two automatic stations run by Meteocat inside the city. Barcelona – el Raval sits at an altitude of 33 m and publishes averages for the period 2010-2025. Barcelona – Observatori Fabra, on the hill above the city, sits at 411 m and covers the same period. Every measured temperature, rainfall and heat-day figure below belongs to one of these two stations and to that period, as the station sheets state it.
Temperatures through the seasons
At the Raval station, the average monthly temperature for 2010-2025 ran from 11.4 °C in January to 26.3 °C in August, with an annual average of 18.2 °C, according to the station sheet. The average daily maximum was 14.9 °C in January and 29.5 °C in August, while the average daily minimum was 8.6 °C in January and 23.6 °C in August.
The shoulder seasons sit between those poles. On the same Raval sheet, the average monthly temperature was 15.8 °C in April and 18.9 °C in May, then 20.0 °C in October and 15.3 °C in November. Spring and autumn are therefore mild rather than cold, but evenings and rainy days still call for a layer.
Height changes the picture. The Fabra sheet gives an annual average of 15.6 °C, with 8.4 °C in January and 24.0 °C in August. Frost is rare: the Fabra station recorded 2.7 frost days in an average year, defined by Meteocat as days with a minimum below 0 °C, while the Raval station recorded 0.0 frost days. The gap between the two stations is one reason a guide to Barcelona neighbourhoods is useful before choosing where to stay.
Summer heat and tropical nights
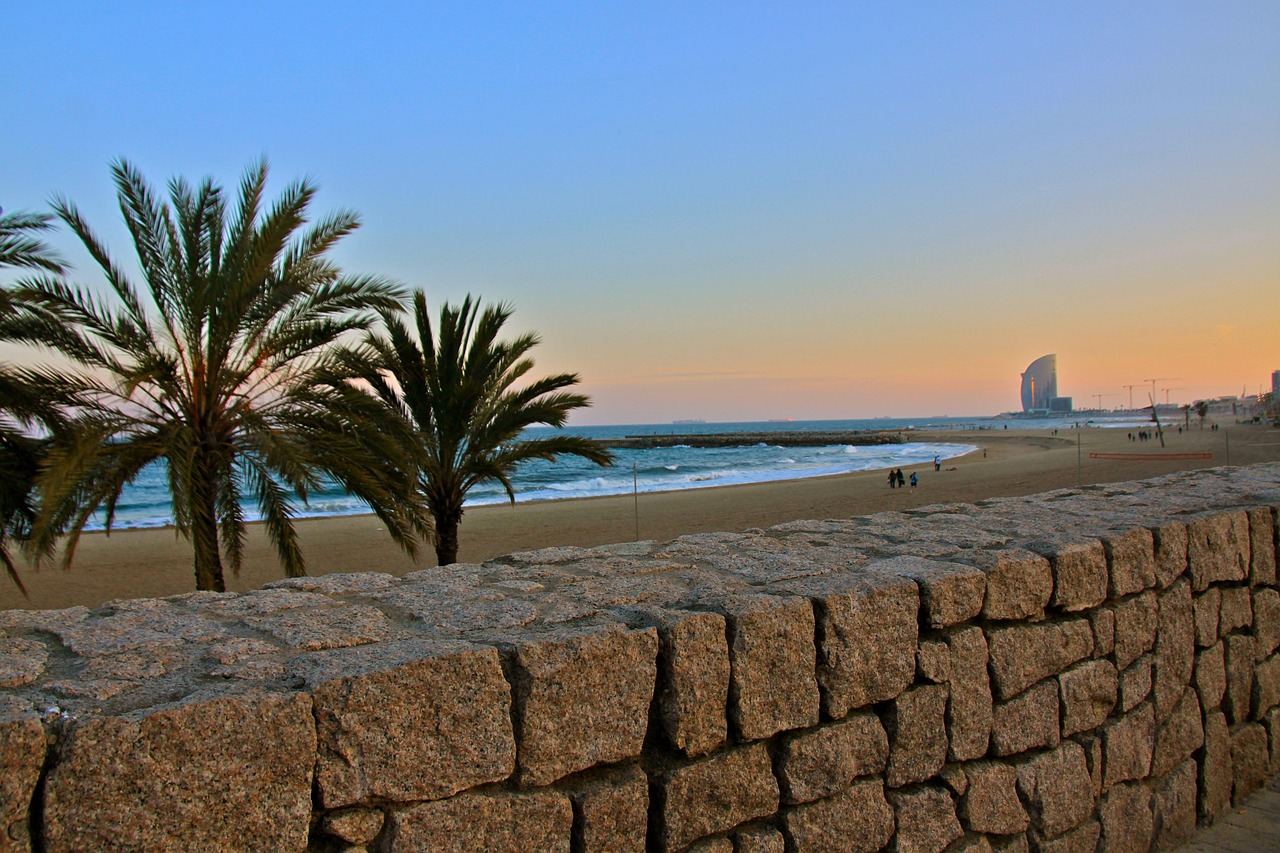
Meteocat counts two kinds of warm event in its station sheets. A hot day is one with a maximum above 30 °C, and a tropical night is one with a minimum above 20 °C. At the Raval station, the 2010-2025 average was 27.9 hot days a year, including 10.4 in July and 11.4 in August, according to the Raval sheet. Tropical nights averaged 98.3 a year, with 28.8 in July and 29.2 in August.
In July and August, a large share of nights at Raval stayed above that 20 °C line, so the heat does not fully release overnight. Anyone planning to sleep without air conditioning should weigh that against the daytime figures.
The highest temperature recorded across the period was 39.3 °C at Raval, and 39.5 °C at the Fabra station, as both station sheets list it (Raval and Fabra). The strength of the sun follows the same seasonal curve: the Raval sheet gives an average daily global solar irradiation of 25.7 MJ/m2 in June, against 7.0 MJ/m2 in December.
Rainfall and storms
Annual precipitation averaged 586.5 mm at Raval and 578.3 mm at Fabra for 2010-2025, according to the Raval sheet and the Fabra sheet. At Raval, September was the wettest month with 77.9 mm, followed by October with 76.9 mm, while June was the driest with 25.0 mm.
Rain falls on relatively few days. The Raval station counted an average of 67.7 days a year with more than 0.2 mm, and only 6.6 days with more than 25 mm, as the Raval sheet shows. The Fabra sheet records a heaviest 24-hour fall of 139.9 mm in November, a reminder that the occasional autumn storm can be intense even in a fairly dry city.
For travellers the practical reading is simple: the wettest months at the Raval station fell in autumn, so it pays to check the forecast before a day of walking.
How the city responds to extreme heat
The city council runs a Climate Shelters Network. Its network page describes shelters as spaces to escape the heat in summer and the cold in winter, and says the network currently includes more than 500 spaces in summer and more than 300 in winter. They are free to enter, apart from municipal swimming pools, and indoor spaces are advised to keep air conditioning at 26 ºC in the summer months. Smaller micro-shelters, such as pharmacies and shops, offer a free place to sit for a short stay. The shelters are not meant for people who need medical attention, and the page advises calling the health services (061) in case of high fever, headache, nausea or intense thirst.
The council’s June 2026 announcement for that summer said that 99.2% of people in the city had a shelter within a ten-minute walk of home, that over 75% of the shelters were indoor facilities, and that there were more than sixty micro-shelters. It described the operation as a response to rising extreme temperatures from June to September.
Shelters sit inside a wider Heat Plan, which lists measures such as more water play areas, shade structures where trees cannot be planted, reflective or green surfaces on pavements and rooftops, and climate adaptation in schools and care homes.
Looking further ahead, the council’s page on how climate change affects the city reports that, under the RESCCUE project, average summer temperatures could rise by 3°C in a committed emissions scenario and by 5.5°C in a passive one by the end of the century, with rainfall falling by around 15% in the committed scenario. These are model projections, not forecasts, and the council notes that the rainfall trend in particular carries a high degree of uncertainty.
What to pack by season
This is general travel advice, not a medical or weather guarantee. The council’s own heat tips are a good starting point for summer: wear light, light-coloured, loose clothing such as cotton, cover the head with a cap, hat or umbrella, carry water and drink often, and avoid the streets in the hottest hours around midday.
- Summer: breathable fabrics, a hat, a refillable water bottle, comfortable shoes for hot pavements, and a light cover-up for air-conditioned museums and trains.
- Autumn: a light waterproof layer and shoes that cope with wet pavements, because Meteocat notes that the sea can feed episodes of torrential rain in autumn.
- Winter: a medium-weight coat, a scarf and layers rather than heavy parkas, since the Meteocat description points to mild, mostly dry winters.
- Spring: layers that come off easily, plus a small umbrella for showers.
Clothes that suit the climate are also a good excuse to look at where cloth comes from. Readers curious about the city’s cloth-making past can follow the story in Barcelona textile history.
Frequently asked questions
When is the hottest time of year in Barcelona?
July and August are the warmest months in the Meteocat station averages, and the tropical nights are concentrated in July and August as well.
Does Barcelona get cold in winter?
Frost is rare at city level, as the Raval and Fabra sheets show. Winters are also mostly dry, so a coat is useful, but bulky gear is rarely needed.
Where can people cool down for free?
The council’s climate shelters include libraries, museums, community centres and parks, and they are free to enter apart from municipal pools. The network page has a map with filters, and opening hours should be checked before visiting.
Is summer in Barcelona dry?
Summer months bring less rain than autumn in the Raval figures, with June the driest month, but storms are still possible. The heaviest coastal rain tends to come in autumn.